

Problem Statement
The acquisition of a AdMeta, a demand-side ad exchange platform positioned WideOrbit to provide publishers automated ad transactions and buyers the ability to aggregate and purchase audio inventory. However the technology was over 20 years old and was designed to support display ad transactions. The underlying technology, using pixel tracking was adapted to buy, manage, and track streaming audio and video inventory. While this technical adaptation allowed monetization of streaming content, it was not self-serve, requiring a support team to set up transactions manually. It also lacked an analytics dashboard and reporting interface, providing publishers the ability to track their campaigns and ad inventory.
Refactor UI to support streaming audio and video content with pixels.
Provide publishers an ad inventory dashboard to monitor monetization of streaming content.
Provide publishers custom reporting within the platform, to track ad inventory at a campaign level.
Allow publishers to maximize digital ad revenue, auction unsold inventory, control pricing, and advertiser content.


Making Legacy Software Actionable and User Friendly
The first step was understanding the capabilities of the existing software UI. This required a deconstruction of the user interface, and platform features, to identify what elements supported our current use case and which should be removed.
I worked directly with our Director of Ad Management to identify use cases. We then ran tests to validate if these use cases could be supported. During this process we identified features that supported these use cases and eliminated those that did not.
Competitive Research/SME interviews
I conducted competitive research to understand how other ad platforms handled analytics and reporting. This work elucidated industry conventions in how data was shaped, key metrics tracked, and filtering and parameter settings used to produce custom reports.
Partners at Adswizz, Triton, and Google where interviewed to identify key reporting features and metrics.


Defining Workflows and Dependencies
To fully understand dependencies the technical ecosystem was mapped. This provided insights into data end-points, providing agencies, demand-side platforms, and brands direct access to the sellers’ inventory. This work resulted in identification of key metrics, parameter sets, and filters.
Wireframing and Lo-Fidelity Prototyping
The UI was wireframed to visualize users would flow from an dashboard view to custom reporting at a campaign level.
Wireframes were shared amongst a small group of publishers to gather feedback on the intuitiveness of the reporting UI, validate filter sets and reporting parameters, and confirm the UI supported current use cases.


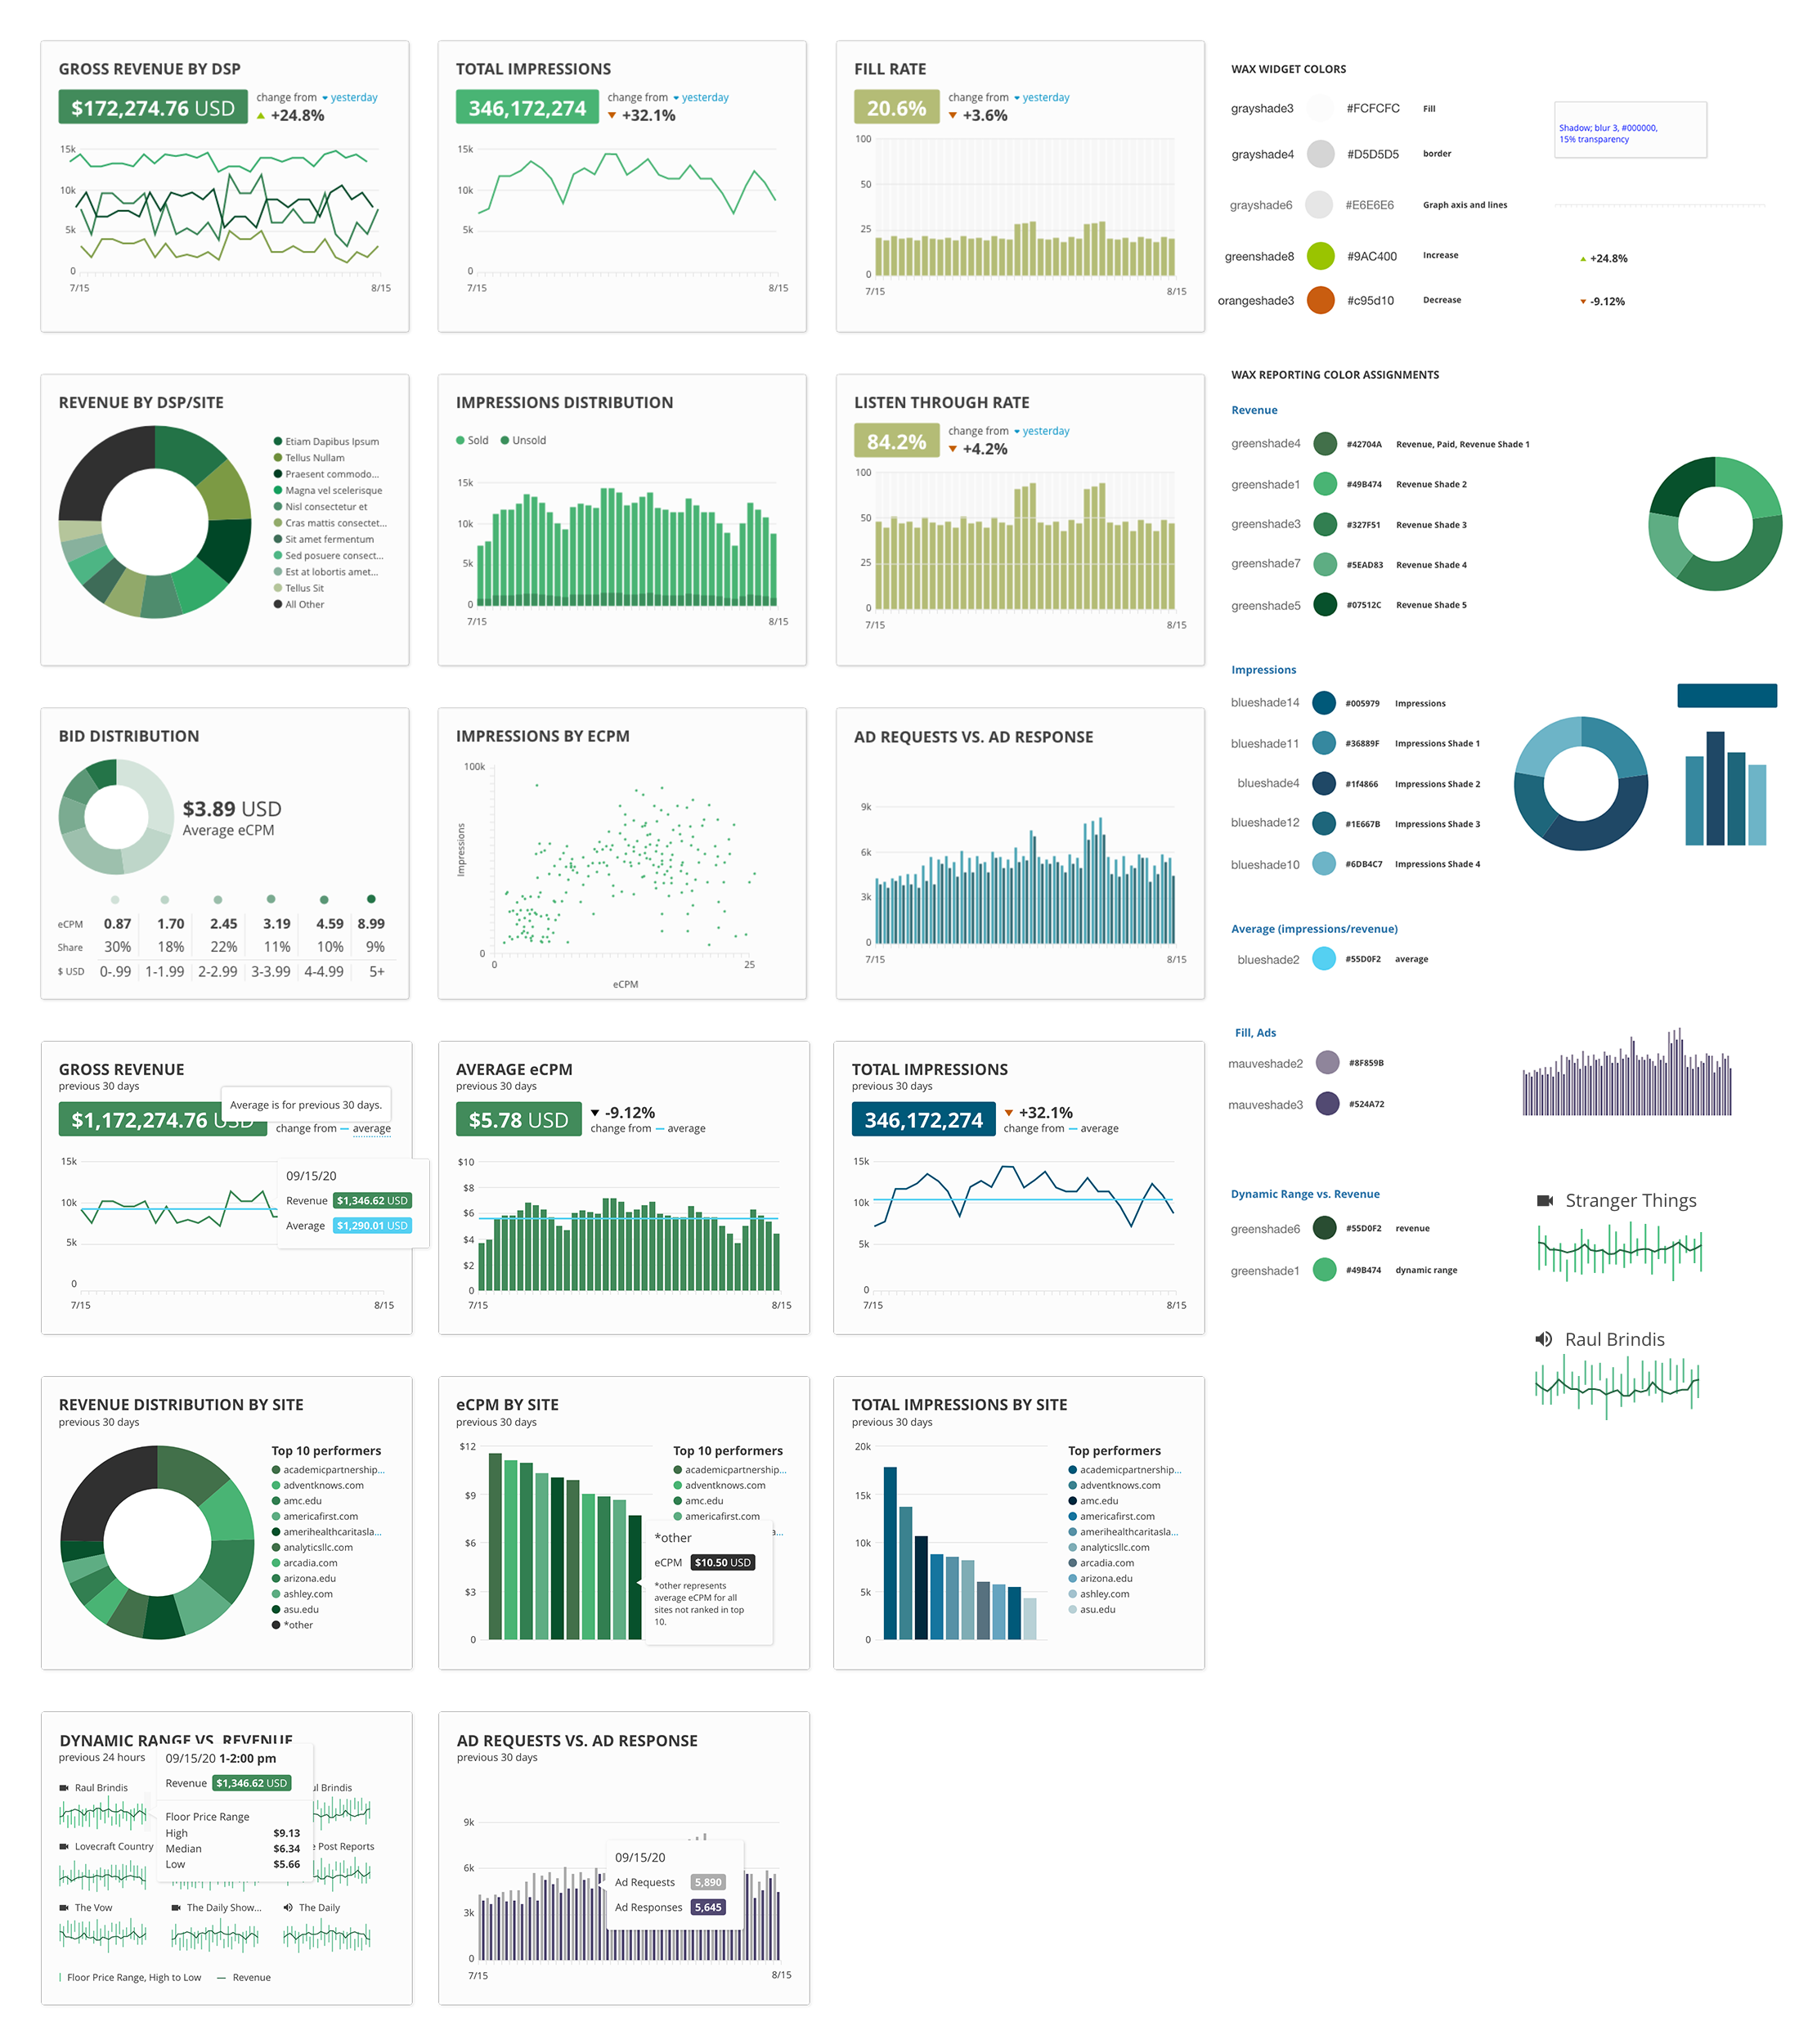
Designing for Data and Reporting
A design system was developed for the presentation of data. The system had to support multivariate data sets, change over time, in aggregate, and trends.
I worked with engineering to identify Chart.js as the charting framework used to support the presentation layer of the data. This framework was chosen because of its supported charting methods, customizability and ability to render using HTML5 canvas.
A color palette was developed and tested to ensure color combinations were WCAG accessible for color blind users.
Dashboard and UI Mockups

Final Reporting Dashboard

Account Level Custom Report

Custom Report Generator UI

Multivariate Filter and Parameter Selection
Outcomes and Key Takeaways
Coming Soon!